Introduction
This assignment served as
an introduction to surveying with high precision GPS unit. The class collected elevation
data of a very small defined area as a group and then created continuous
surface raster layers using the five common interpolation methods: IDW,
Kriging, Natural Neighbor, Spline, TIN.
Study Area
The area of study was a
small grassy knoll in the heart of the UW Eau Claire campus mall. This area between
Centennial, Schofield, and Schneider Halls is affectionately known as the
“black tombstone ring,” so called because of the black stone benches which are
arranged in a circle around the iconic Sprite statue (Fig.1). Our knoll is at
the base of the sprite statue on the side closest to the science building,
Philips Hall.
 |
| Figure 1 The Sprites statue is at the heart of the campus mall of UW Eau Claire. Upon completion of Centennial Hall in 2015, the Sprites statue was moved to this pedestal surrounded by black stone benches and symmetrical knolls. Photo credit: Jim Arnold. |
The knoll forms the shape
of a small trapezoid, little more than 20 square meters bounded on four sides
by sidewalks (Fig.2). It contains five tiny ornamental saplings and four black stone
benches, which are very abstract and artsy looking, though in a decidedly more
simplistic vein than the Sprite statue. The elevation of the knoll is defined by
a small hillock running along the wider southern face of the knoll. The four
stone benches are on a flat area facing the Sprite statue.
 |
| Figure 2 The study area is denoted by the arrow. This image is from Google Earth Pro (2016). The Sprite statue is in the center of the ring. |
Materials
- Survey grade GPS: TopCon HiPer SR
- TopCon Tesla handheld unit
- ArcMap for Desktop 10.4.1
The TopCon equipment (Fig.3)
made data collection very simple and efficient. The HiPer SR was mounted onto a
survey tripod that had a level to ensure that the GPS unit was parallel to the
ground. The Tesla handheld unit was used to enter the data.
 |
Figure 3 The TopCon Tesla handheld unit and the TopCon HiPer SR, the high precision GPS unit which can record elevation and location to sub-centimeter accuracy.
|
Methods
The class walked to the
study area and received an instructional demo from Dr. Hupy about how to
position the tripod and GPS unit, and how to record data using the Tesla
handheld unit. Each person in the class took a turn positioning the tripod and
recording 1-3 data points within the small grassy knoll (Fig.4). The class,
after discussing sampling methods, went with a simple stratified point
collection method because of its flexibility. Special attention could be paid
to the edges of the hill and in defining the extent of the flat area.
For more information on
sampling methods, check out the Royal Geographical Society page.
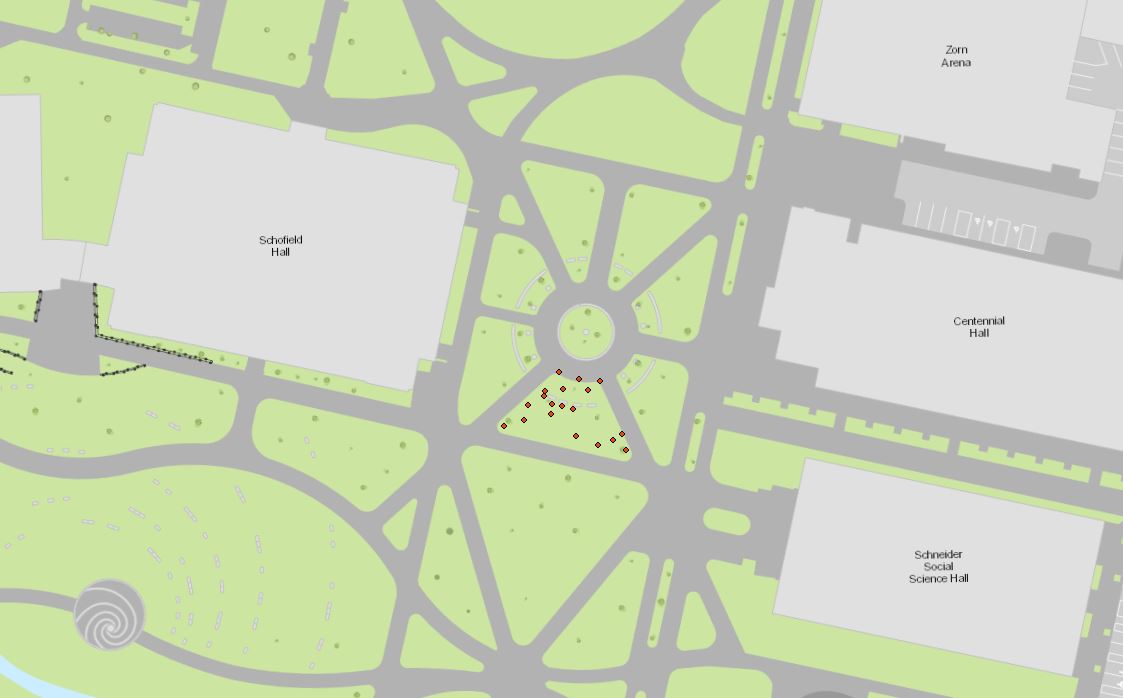 |
| Figure 4 This figure shows the UWEC campus and the study area with the collected data points. |
The result was a data table of
nineteen points of elevation data which was shared to the class as a txt file
which was located in the TEMP folder. This had to be copied into individual student
folders and normalized. The data was downloaded into Excel using the Data>From TXT command. Normalized
the formatting by changing headers to Point_ID, Y, X, and Z (Fig.5).
 |
| Figure 5 The normalized data ready to be imported to ArcMap! |
In ArcMap for Desktop, a file
geodatabase was created and the excel table opened. Selecting the “Display XY
Data” option created an event theme. The coordinate system was set to NAD 1983
UTM Zone 15N. Then the event theme could be exported as a point feature class.
In order to transform the point data
into continuous surface rasters, interpolation tools were necessary to mathematically
generate elevation values to fit between the collected data points. (See the
Activity #5 post for information on interpolation techniques.) The five common
interpolation methods -- IDW, Kriging, Natural Neighbor, Spline, and TIN—were run
on the data using the respective tools. In order to define the study area, a polygon
feature was created to show the boundary of the study area and then used as a
mask to clip the interpolation results. Unfortunately, there was no tool to
clip the TIN results.
Results/Discussion
The elevation results were
less than dazzling. The actual shape of the hill was not captured accurately in
any of the continuous surface results (Fig.6). It is clear that there were
sampling problems with the data, the most obvious problem being the small sample
size of elevation points collected with the GPS.
 |
| Figure 6 The results from the various interpolation methods compared to an aerial image of the study area from Google Earth Pro (2016). The orange points indicate the data points collected by the class. Notice that there are areas where no data was collected; this had a negative impact on the accuracy of the interpolations. |
Sampling problems are a
part of map making that is common and dangerous. According to the Royal
Geographical Society, these are some of the considerations one must make when
sampling a study area:
- Larger sample sizes are more accurate representations of the whole
- A sampling strategy made with the minimum of bias is the most statistically valid
- Most approaches assume that the parent population has a normal distribution where most items or individuals clustered close to the mean, with few extremes
- Sampling, no matter how good can only ever be claimed to be a very close estimate
Regarding the stratified
sampling method that was used in this field activity, the proportions of the
sub-sets must be known and accurate if it is to work properly. Not only did the
class not measure and record the proportions of sub-sets, there were no
sub-sets set up in the first place. In the ArcCollector Activity done in
November, the class also used a stratified sampling technique when collecting
data points around the UWEC campus, but the campus was split into five distinct
zones to ensure somewhat even coverage of all areas. In this activity, however,
the data collection was unorganized and uncoordinated, and that clearly had a
negative impact on overall accuracy.
In this assignment, there
were only 19 data points to work with, which was not a large enough sample size
to interpolate the elevation of the area accurately. Since the area was so
small, the class easily could have collected more points. However, being
limited to one GPS unit meant there was quite a bit of standing idle and the
cold rain was good motivation for the students to cut the data collection short.
Conclusions
Overall, the final product suffered
from a lack of data. None of the interpolated elevation maps captured the true
relief of the study area. This activity served as an excellent intro to TopCon
products and data collection with survey grade GPS units, but did not result in
accurate maps of the study area.
 |
| UWEC campus mall. Photo Credit: Bill Hoepner |
No comments:
Post a Comment